Investments in machinery and equipment are often associated with improved productivity and competitiveness in manufacturing. While offering a glimpse into the future growth of the sector, exploring the trends in such investments also provides insights into the measured success of different jurisdictions in attracting advanced manufacturing investments.
A recent Trillium Network data bulletin examined investment trends for individual Ontario manufacturing industries. The average annual investment has surged substantially for all major industries after 2017– both in nominal terms and as a ratio of industry-specific GDP figures.
This data bulletin puts that surge into perspective. It does so by exploring how Ontario manufacturing sector investments in machinery and equipment stack up against those in other jurisdictions for years between 2012 and 2021. As a result, it sheds light on the relative success of Ontario in sustaining and growing its manufacturing sector.
For this analysis, we draw upon Statistics Canada’s Annual Capital and Repair Expenditures Survey (Table 34-10-0035-01), and the U.S. Census Bureau’s Annual Survey of Manufactures (Tables AM1631AS102 and AM1831BASIC01) and Economic Census (Tables ECNBASIC2012 and EC1731BASIC). For the remainder of this bulletin, capital expenditures refer to those related to machinery and equipment. While also key to improving productivity and competitiveness, the data explored here does not capture investments made in digital technologies, some of which offer major benefits to manufacturers.
The Figure below compares the manufacturing sector average annual capital expenditures relative to GDP in select jurisdictions across Canada and the United States. Ontario and select Canadian jurisdictions saw a higher investment rate (*) between 2017 and 2021 than in the preceding five-year period. In contrast, for most U.S. states included in our analysis, the trend was in the opposite direction.
Figure – Manufacturing Sector Average Annual Capital Expenditures on Machinery and Equipment as a Percentage of the Sector’s Nominal GDP (**), Select Jurisdictions
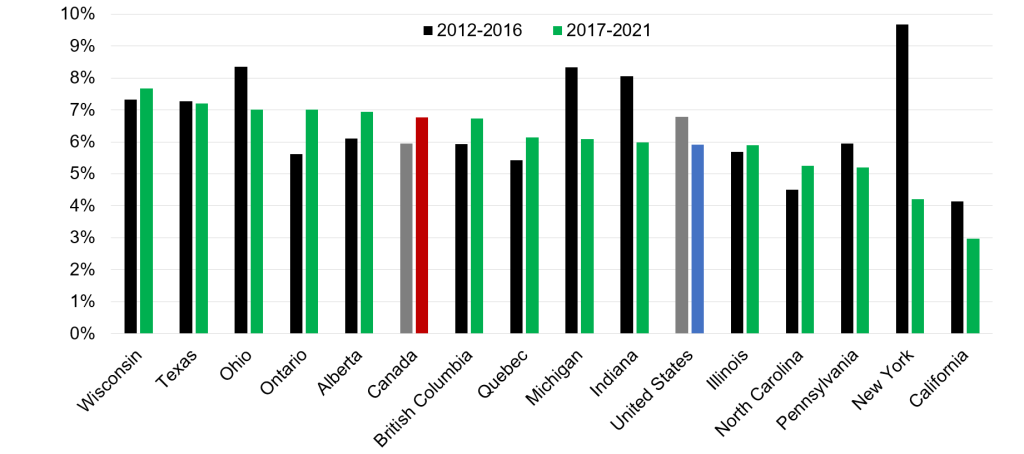
Ontario’s ascendance, settling in a virtual tie for the third spot with Ohio during the latter five-year period, is positive news. As reported in the June 2023 data bulletin, between the two time periods, Ontario’s average capital expenditures rose by 36 percent. The transportation equipment, primary metal, and chemical manufacturing industries were responsible for a large part of the increases in investments. These changes indicate an optimistic view of the province’s fortunes as they could increase productivity, a long-running concern for manufacturing in Canada.
The positive momentum may well be sustained with the announcements of major investments related to EV battery manufacturing in the province in addition to reshoring and near-shoring initiatives as governments and companies try to navigate changing supply chain dynamics.
Government policies and strategy may also play a key role in determining the outlook. Whether they are incentives to compete with those offered in the U.S. Inflation Reduction Act, supporting advanced technology or promoting a diverse and inclusive workforce, policies designed to sustain Ontario manufacturing are critical to helping the sector compete.
As one of North America’s largest manufacturing jurisdictions by GDP (see Data Bulletin Number 7), Ontario has advantages–including a talented workforce and a comprehensive support ecosystem– that make the province a desirable jurisdiction for investments. Well-aligned provincial and national strategies can help the province build on the sector’s recent positive investment momentum to establish a more productive and competitive future for the industry.
(*) Investment rate refers to the manufacturing sector capital expenditures on machinery and equipment as a percentage of the nominal GDP for the sector.
(**) Authors use this metric in order to control for the size of the manufacturing sector in each jurisdiction and eliminate potential irregularities arising from exchange rate changes across the compared time periods. Nominal GDP figures for Canadian jurisdictions in years 2020 and 2021 were estimated by adjusting the chained (2012) dollar figures in Statistics Canada Table 36-10-0402-01 (formerly CANSIM 379-0030), using implicit price indexes in Statistics Canada Table 36-10-0223-01 (formerly CANSIM 384-0039).
Key Takeaways
- Capital expenditures are useful for understanding the trajectory of Ontario’s advanced manufacturing sector productivity and competitiveness vis a vis other jurisdictions.
- The Ontario manufacturing sector’s capital expenditures as a percentage of its GDP were considerably higher between 2017 and 2021 than they were between 2012 and 2016.
- The rise in the investment rate indicates an optimistic view of the province’s fortunes as it could increase productivity of the sector in the long-term.
- The positive momentum may be sustained with the recently announced major investments in EV battery manufacturing and related supply chain.