A recent article* published by RBC Economics emphasizes challenges related to efforts in Canada to reshore manufacturing and improve supply chain resilience. The article, written by Josh Nye, points astutely to the fact that public policies designed to support manufacturing in Canada tend to focus on select industries, such as electric vehicles and vaccines.
If this is indeed the case, it raises some questions: is specialization in high-value industries such as motor vehicle and pharmaceutical product manufacturing a bad thing? Similarly, how specialized is the manufacturing sector in Canada, and specifically, in Ontario, which accounts for approximately 43 per cent of all manufacturing GDP in Canada? Finally, how does this compare to other manufacturing-focused jurisdictions in North America?
Specialization in a small number of industries allows jurisdictions to focus on high-value activities, achieve economies of scale, and develop world-leading expertise and industry-specific knowledge. Think the automotive industry in Michigan, the aerospace industry in Toulouse, France, and semiconductor manufacturing in Taiwan. Yet specialization may exacerbate the effects of sector-specific downturns or supply chain disruptions, and can make it more difficult to pivot during crises.
Diversification, on the other hand, helps jurisdictions weather economic downturns, shift focus during crises, and create collaborative innovation networks that transcend industries. Diversification, though, may also spread expertise too thin, lead to a focus on low-value activities that are not compatible with high-wage and innovation-based economies, and make it more difficult to achieve economies of scale.
To determine how specialized (or diversified) Ontario’s manufacturing sector is, and how it compares to other jurisdictions across Canada and in the United States, the Trillium Network for Advanced Manufacturing developed a manufacturing specialization index. The index draws upon government statistics. It subtracts the combined proportion of GDP generated by the bottom quintile of manufacturing industries (as defined by 3-digit NAICS codes) from the top quintile in each jurisdiction. A higher rating indicates a more specialized manufacturing sector, a lower rating indicates a more diversified sector (see figure below).
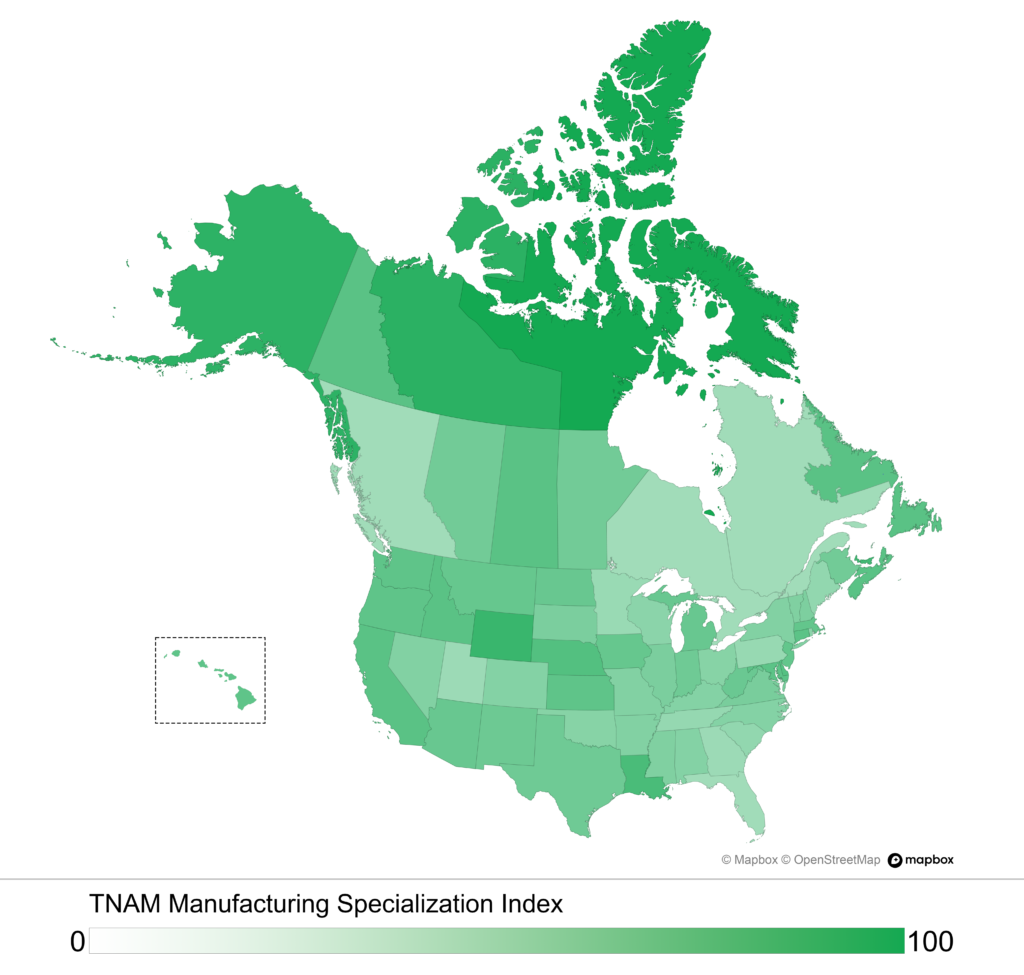
The results show that Ontario has a relatively diverse manufacturing sector, although it has become more specialized over the past two decades. Ontario ranks 11th among provinces and states in terms of manufacturing GDP (between Wisconsin and Georgia), and has a relatively diverse manufacturing sector, although it has become more specialized over the past two decades. But the province ranks only behind Quebec, Florida, Georgia, Minnesota, and Pennsylvania in terms of diversification among the top one-third of jurisdictions in this sample (see table below).
Put another way, Ontario’s manufacturing sector is not terribly specialized relative to other jurisdictions in the United States and Canada. The most specialized jurisdictions include Louisiana and its oil refineries, Washington and its Boeing-led aerospace industry, and California, whose computer and electronics manufacturing industry GDP is roughly equivalent to that of Canada’s entire manufacturing sector.
These data also demonstrate that while manufacturing is vital to Ontario’s economy, the sector exists within a very diverse provincial economy. Ontario’s manufacturing sector represents approximately 11.5 per cent of the province’s GDP. This is second in Canada only to Quebec, where manufacturing represents 13 per cent of GDP, and is similar to California (11.3 per cent) and Texas (12.4 per cent), the two largest manufacturing jurisdictions in the United States. It is, however, much lower in proportional terms than the Great Lakes states (Michigan, Ohio, Illinois, Indiana, Wisconsin, Minnesota, and Pennsylvania), with which Ontario’s manufacturing supply chains are highly integrated.
Our analysis also shows that, with some exceptions, jurisdictions with large transportation equipment industries tend to be more diversified, possibly because of the number of other manufacturing activities necessary to support automation and aerospace supply chains. Moreover, it shows that jurisdictions with large petroleum and petro-chemical product manufacturing industries tend to be less diversified and thus highly susceptible to oil price fluctuations.
Now back to Ontario. If the province’s manufacturing sector is as diversified as our analysis suggests, how can that diversity be leveraged to encourage growth and improve competitiveness? The Greater Toronto and Hamilton Area (GTHA), where a majority of Ontario’s manufacturing sector is concentrated, is the only major North American metropolitan area with large-scale motor vehicle and aircraft manufacturing activities. The presence of large pharmaceutical and integrated steel manufacturing industries in the region makes the GTHA especially unique in this regard.
Key takeaways:
- Ontario’s manufacturing sector is 1) large and 2) relatively diversified when compared to other jurisdictions. Ontario’s economy is also relatively diversified.
- Diversified economies mean diverse public policy priorities. There is little question that this is the case in post-pandemic Ontario.
- To properly leverage Ontario’s manufacturing sector may mean better integrating it with other important regional industries and ecosystems, such as healthcare, ICT, agri-food, construction, and R&D.
- In so doing, and in addition to the outsized contributions the sector makes to Ontario’s economy, manufacturing may be able to directly help address ongoing societal challenges related to housing, public health, labour markets, supply chain security, and prosperity generally.
| Jurisdiction | Manufacturing GDP (millions US$) | Specialization Index | Top Manufacturing Industry |
|---|---|---|---|
| California | $394,829 | 0.70 | Computer and Electronics |
| Texas | $226,954 | 0.61 | Chemicals |
| Ohio | $114,757 | 0.51 | Chemicals |
| Illinois | $114,730 | 0.56 | Chemicals |
| Indiana | $104,735 | 0.61 | Chemicals |
| North Carolina | $102,346 | 0.52 | Beverage and Tobacco |
| Pennsylvania | $101,948 | 0.44 | Chemicals |
| Michigan | $101,340 | 0.64 | Transportation Equipment |
| New York | $75,237 | 0.53 | Chemicals |
| Wisconsin | $66,317 | 0.49 | Food |
| Ontario | $65,036 | 0.44 | Transportation Equipment |
| Georgia | $64,946 | 0.42 | Food |
| Florida | $64,481 | 0.40 | Chemicals |
| Washington | $63,290 | 0.68 | Transportation Equipment |
| Tennessee | $62,127 | 0.45 | Transportation Equipment |
| New Jersey | $60,497 | 0.66 | Chemicals |
| Massachusetts | $56,139 | 0.66 | Computer and Electronics |
| Minnesota | $53,130 | 0.43 | Computer and Electronics |
| Virginia | $49,500 | 0.57 | Beverage and Tobacco |
| Missouri | $41,748 | 0.53 | Food |
| Kentucky | $41,194 | 0.52 | Transportation Equipment |
| Louisiana | $40,282 | 0.77 | Petroleum and Coal |
| Alabama | $39,633 | 0.52 | Transportation Equipment |
| South Carolina | $39,266 | 0.46 | Transportation Equipment |
| Iowa | $38,561 | 0.65 | Machinery |
| Quebec | $38,468 | 0.38 | Transportation Equipment |
| Arizona | $37,604 | 0.64 | Computer and Electronics |
| Oregon | $36,209 | 0.68 | Computer and Electronics |
| Connecticut | $34,877 | 0.69 | Transportation Equipment |
| Colorado | $28,884 | 0.52 | Computer and Electronics |
| Kansas | $28,677 | 0.68 | Transportation Equipment |
| Maryland | $26,411 | 0.69 | Chemicals |
| Utah | $25,208 | 0.42 | Food |
| Arkansas | $21,849 | 0.53 | Food |
| Mississippi | $20,127 | 0.54 | Petroleum and Coal |
| Alberta | $18,697 | 0.63 | Chemicals |
| Oklahoma | $18,591 | 0.51 | Transportation Equipment |
| Nebraska | $16,878 | 0.73 | Food |
| British Columbia | $13,168 | 0.39 | Wood Products |
| New Hampshire | $9,993 | 0.55 | Computer and Electronics |
| Idaho | $9,669 | 0.70 | Food |
| Nevada | $9,448 | 0.53 | Miscellaneous |
| West Virginia | $8,490 | 0.63 | Chemicals |
| Maine | $7,787 | 0.46 | Transportation Equipment |
| Delaware | $5,601 | 0.72 | Chemicals |
| Rhode Island | $5,281 | 0.49 | Chemicals |
| Manitoba | $5,105 | 0.6 | Food |
| South Dakota | $4,964 | 0.56 | Food |
| North Dakota | $4,537 | 0.64 | Machinery |
| New Mexico | $4,266 | 0.62 | Computer and Electronics |
| Sasketchwan | $4,150 | 0.68 | Petroleum and Coal |
| Vermont | $3,463 | 0.54 | |
| Montana | $3,378 | 0.65 | Petroleum and Coal |
| Wyoming | $2,948 | 0.84 | Petroleum and Coal |
| New Brunswick | $2,570 | 0.60 | Food |
| Nova Scotia | $2,329 | 0.65 | Plastics and Rubber |
| Alaska | $1,720 | 0.89 | Food |
| Hawaii | $1,679 | 0.68 | Petroleum and Coal |
| Newfoundland and Labrador | $736 | 0.74 | Food |
| Prince Edward | $522 | 0.82 | Food |
| District of Columbia | $331 | 0.72 | Chemicals |
| Yukon | $17 | 0.70 | Plastics and Rubber |
| Northwest Territories | $11 | 0.94 | Chemicals |
| Nunavut | $11 | 1.00 | Chemicals |
Data Sources: U.S. Bureau of Economic Analysis (BEA), U.S. Census Bureau, Statistics Canada
* RBC article Proof Point: Reshoring hasn’t spurred a Canadian manufacturing renaissance