
News
How diversified is Ontario’s manufacturing sector?

by: Han Sheng Chiang & Brendan Sweeney, PhD
The COVID-19 pandemic has reinforced the importance of a diverse and flexible manufacturing sector. Over the past two months, hundreds of Ontario manufacturers have pivoted in response to the pandemic. Many of these manufacturers are listed on the Trillium Network for Advanced Manufacturing’s (TNAM) website. These manufacturers have been lauded for their innovative capacity, adaptability, and willingness to collaborate during these challenging times.
While Ontario’s manufacturing sector is robust – the largest in Canada and among the largest in North America – output, employment, and contributions to GDP have diminished since the early 2000s. Over the same time, the annual contributions to manufacturing GDP of Ontario’s four largest manufacturing segments – Transportation Equipment (including Automotive and Aerospace), Food, Chemicals, and Machinery – grew from 44% to 51%.
Four Largest Industries’ % of Total Manufacturing GDP in Ontario, 1997-2018
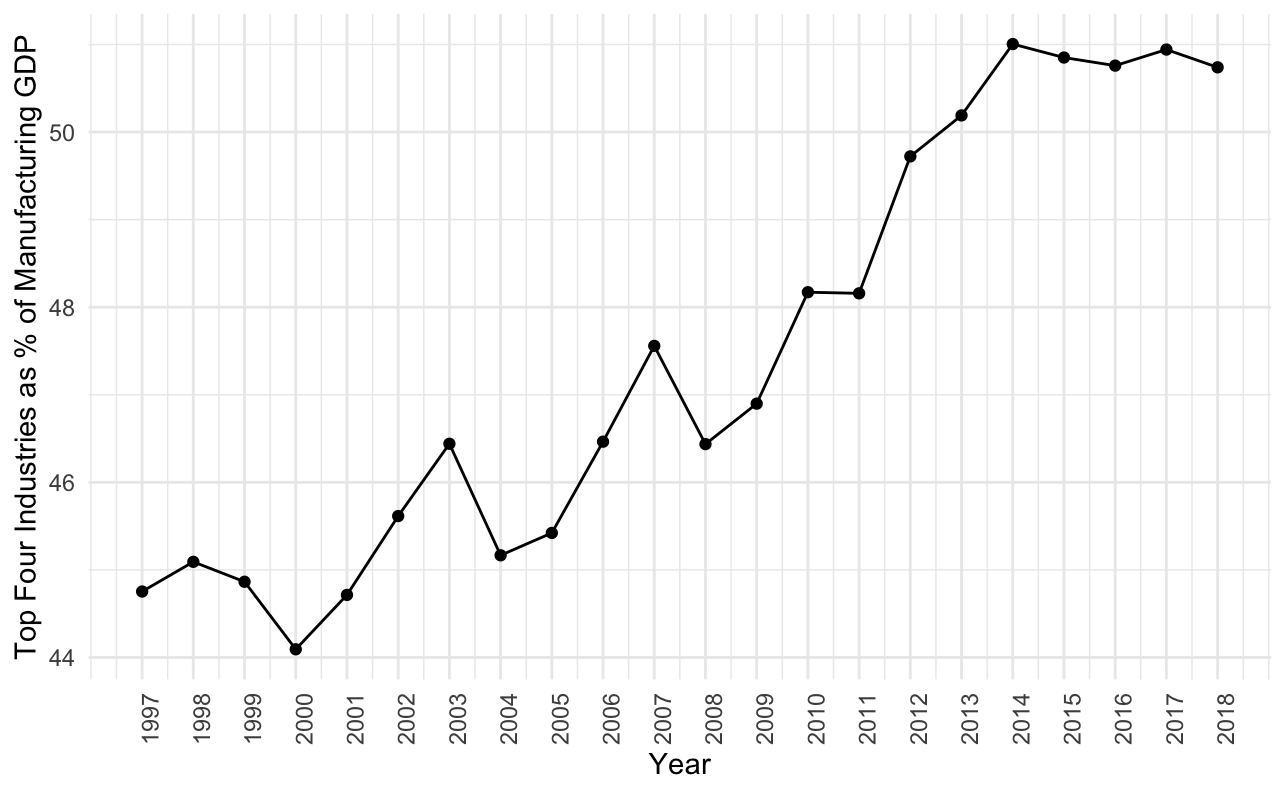
Source: Authors’ Calculations, Statistics Canada, 2020; Table 36-10-0402-01
There are advantages and disadvantages to having a highly specialized or diversified manufacturing sector. Specialization allows a jurisdiction to focus on higher value-added industries, achieve economies of scale, and concentrate industry-specific knowledge. However, specialization increases the impact of a sector-specific downturn and increases a jurisdiction’s reliance on imports. Diversification, on the other hand, means that customers are better able to source products and materials locally and can create collaborative innovation networks across industries. However, diversification may emphasize lower value-added industries at the expense of higher value-added ones, and makes it more difficult to achieve economies of scale.
The increasing specialization of Ontario’s manufacturing sector raises several questions. These questions are especially important in the context of the COVID-19 pandemic. In the short-term, these questions focus on Ontario’s ability to produce essential personal protective equipment (PPE), medical supplies, and medical devices during the pandemic and the gradual reopening of the economy. In the longer term, it raises questions about Ontario’s capacity to develop resilient and adaptable supply chains that are better equipped to produce essential goods in the event of a crisis (medical or otherwise), and that could potentially minimize Ontario’s reliance on importing essential goods and materials in an era of increasingly uncertain trade relationships.
The TNAM Manufacturing Diversification Index
In light of all this, and of the COVID-19 pandemic, we sought out to answer the following questions:
- How diversified (or specialized) is Ontario’s manufacturing sector?
- How does Ontario compare to other Canadian and US jurisdictions?
To help answer these questions we developed a Manufacturing Diversification Index. The index is calculated by subtracting the combined proportion of manufacturing GDP of the bottom quintile of manufacturing segments (each segment is defined by a three digit NAICS code) from the combined proportion of manufacturing GDP of the top quintile of manufacturing segments (also defined by a three digit NAICS code) in any given jurisdiction. A higher rating indicates a more specialized manufacturing sector. The highest possible rating is 100, although that could be spread over up to four manufacturing segments. Conversely, a lower index rating indicates a more diversified manufacturing sector. A jurisdiction whose manufacturing capacity is spread evenly across all three digit NAICS codes would have an index rating of 0.
Some of our results are illustrated in the map, figures, and table below. All data are sourced from Statistics Canada (Table 36-10-0402-01), the United States Census Bureau’s Annual Survey of Manufactures, and the United States Bureau for Economic Analysis’s Annual GDP Tables. All data are for the most recent years that data were available.
Manufacturing Diversification by Jurisdiction in Canada and the United States
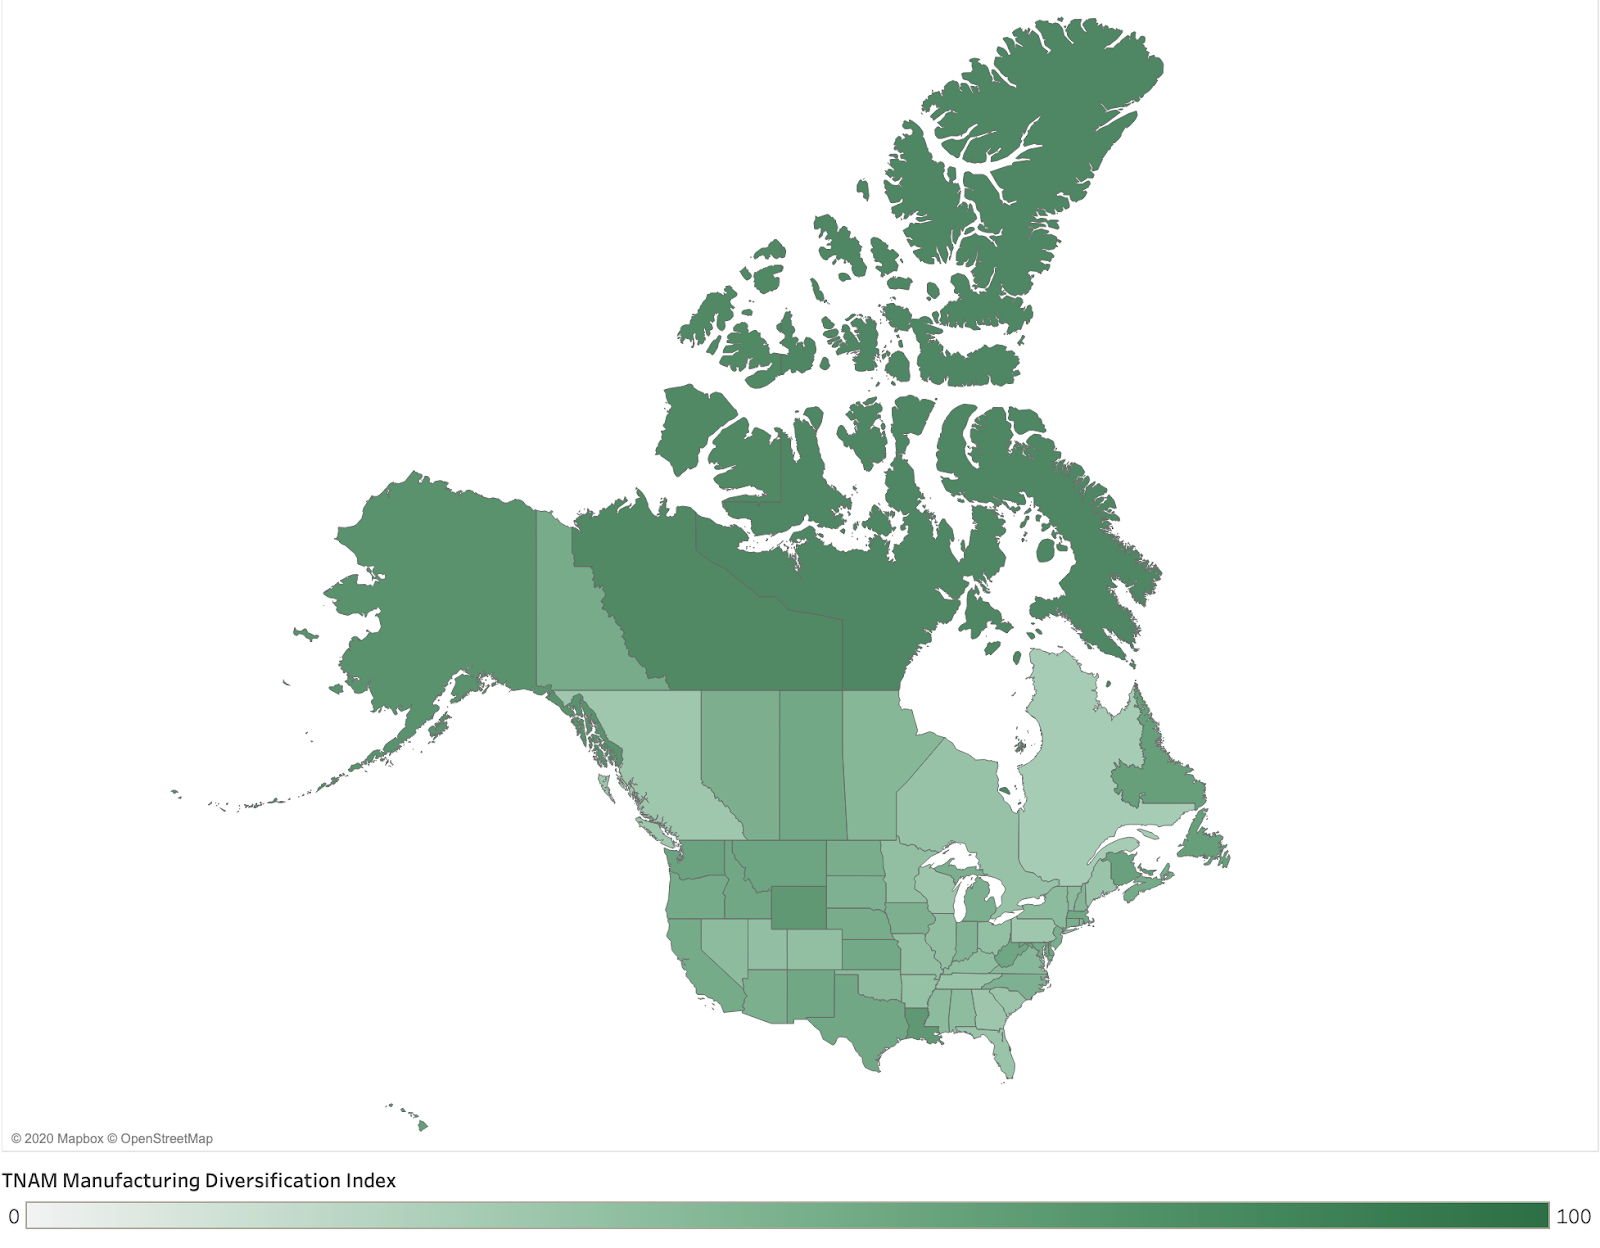
The TNAM Diversification Index shows that:
- Québec and Pennsylvania have the most diversified manufacturing sectors in Canada and the US, respectively. Other large manufacturing jurisdictions that are relatively diversified include Ontario, Ohio, and Illinois.
- Of the largest manufacturing jurisdictions, Louisiana and Washington are the most specialized.
- The largest manufacturing jurisdictions in the US (in terms of GDP) – California and Texas – are themselves highly specialized.
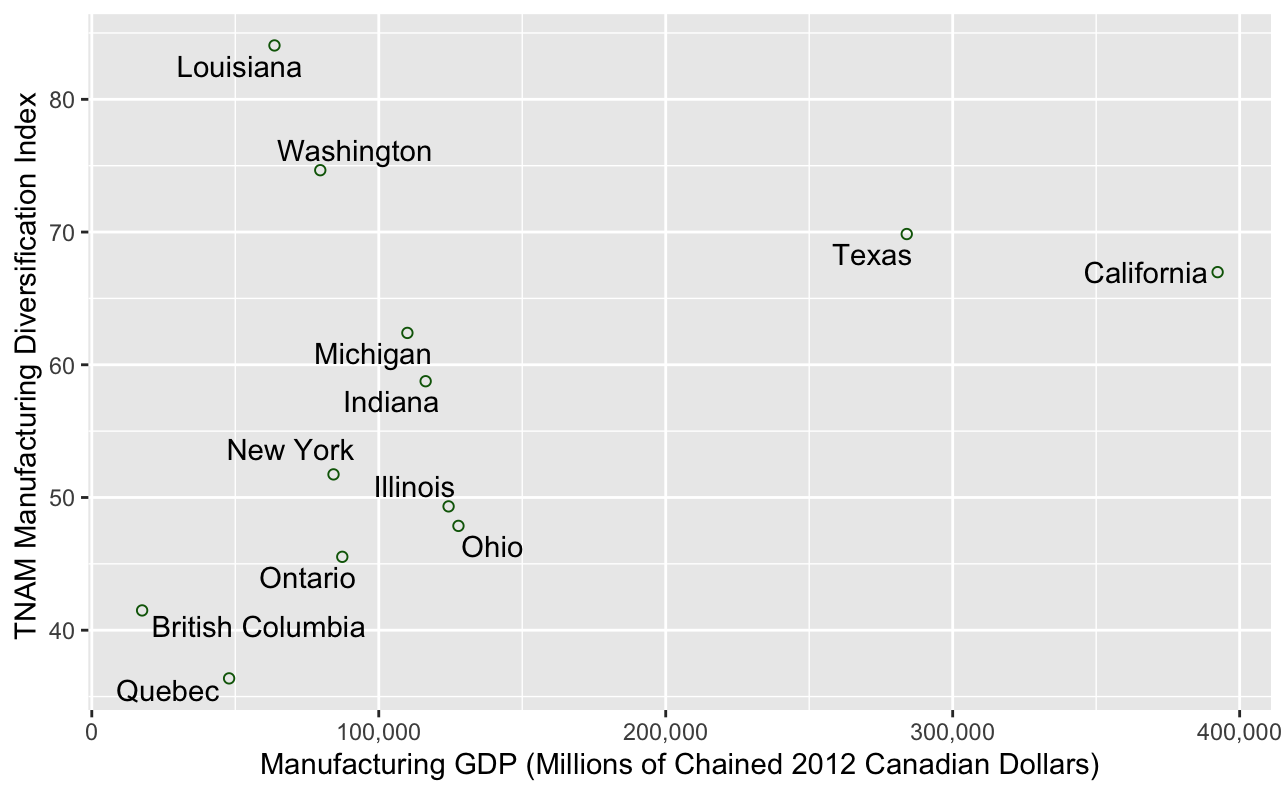
- Jurisdictions with large Transportation Equipment (NAICS 336) manufacturing industries tend to have more diversified manufacturing sectors than those that do not (although outliers exist, e.g. Michigan, Washington). This is likely due to the diversity of manufacturing activities required to support automotive and/or aerospace manufacturing supply chains.
- Conversely, jurisdictions whose largest manufacturing segments are Petroleum and Coal Products (NAICS 324) or Chemicals (NAICS 325) tend to have highly specialized manufacturing sectors.
Manufacturing Diversification Index by Manufacturing GDP, Select Jurisdictions
Where Does Ontario Rank?
Ontario ranks the tenth lowest on the TNAM Manufacturing Diversification Index out of all jurisdictions in Canada and the US. While Ontario’s manufacturing sector has become more concentrated over time, it remains far more diverse than most other large manufacturing jurisdictions in Canada and the US. This is the result of several factors. These factors include 1) the presence of large automotive and aerospace manufacturing industries, 2) the legacy of investments made prior to free trade, and 3) the presence of substantial resource processing industries related to agri-food, forest products, and minerals (much of which is located in the province’s rural and/or northern regions).
Ontario’s manufacturing sector appears better equipped to adapt and respond to crises than the manufacturing sector in most other jurisdictions in Canada and the US. This is due to a combination of highly-scalable and high value-added activities (e.g. automotive), substantial food and pharmaceutical manufacturing capacity, and the capacity to work with a number of materials and meda. By our interpretation, Ontario has a good foundation for further diversification over the longer-term in order to improve the province’s capacity to source essential goods from within (The only place where Ontario’s manufacturing sector really falls short at the moment is in the manufacture of clothing and textiles). Finally, a combined Ontario-Québec manufacturing supply chain would rank among the most diversified manufacturing regions in North America. This suggests value in further integration of manufacturing industries across provincial boundaries.
| Jurisdiction | Index | MFG GDP (Millions $CDN) | Largest MFG Industry |
|---|---|---|---|
| AB | 62.19 | $25,326 | Chemical |
| AK | 89.25 | $2,367 | Petroleum & Coal |
| AL | 51.19 | $43,335 | Transportation Equipment |
| AR | 46.72 | $22,072 | Food |
| AZ | 62.71 | $33,786 | Computers & Electronics |
| BC | 41.49 | $17,538 | Wood Products |
| CA | 66.98 | $392,320 | Computers & Electronics |
| CO | 48.65 | $30,570 | Computers & Electronics |
| CT | 64.26 | $34,490 | Transportation Equipment |
| DC | 62.77 | $349 | Chemical |
| DE | 69.3 | $5,529 | Chemical |
| FL | 43.95 | $64,395 | Computers & Electronics |
| GA | 41.96 | $70,799 | Food |
| HI | 78.29 | $2,569 | Petroleum & Coal |
| IA | 61.52 | $37,130 | Food |
| ID | 70.49 | $10,052 | Computers & Electronics |
| IL | 49.33 | $124,330 | Chemical |
| IN | 58.76 | $116,341 | Chemical |
| KS | 67.87 | $31,638 | Transportation Equipment |
| KY | 49.67 | $43,964 | Transportation Equipment |
| LA | 84.06 | $63,657 | Petroleum & Coal |
| MA | 69.21 | $64,461 | Computers & Electronics |
| MB | 56.17 | $6,046 | Food |
| MD | 66.18 | $27,920 | Chemical |
| ME | 43.83 | $7,051 | Transportation Equipment |
| MI | 62.4 | $109,978 | Transportation Equipment |
| MN | 48.65 | $63,009 | Computers & Electronics |
| MO | 48.8 | $87,705 | Transportation Equipment |
| MS | 51.8 | $43,556 | Petroleum & Coal |
| MT | 72.7 | $4,194 | Petroleum & Coal |
| NB | 75.85 | $3,036 | Food |
| NC | 60.94 | $116,105 | Chemical |
| ND | 64.95 | $4,546 | Machinery |
| NE | 65.32 | $14,869 | Food |
| NH | 57.51 | $11,621 | Computers & Electronics |
| NJ | 63.61 | $60,579 | Chemical |
| NL | 78.04 | $840 | Food |
| NM | 69.47 | $5,304 | Petroleum & Coal |
| NS | 66.19 | $2,512 | Plastics & Rubber |
| NT | 98.33 | $12 | Chemical |
| NU | 100 | $9 | Food |
| NV | 51.74 | $8,327 | Miscellaneous |
| NY | 51.74 | $84,235 | Chemical |
| OH | 47.86 | $127,769 | Transportation Equipment |
| OK | 53.92 | $21,025 | Petroleum & Coal |
| ON | 45.53 | $87,292 | Transportation Equipment |
| OR | 66.3 | $40,895 | Computers & Electronics |
| PA | 40.78 | $107,264 | Chemical |
| PE | 80 | $569 | Food |
| QC | 36.37 | $47,849 | Transportation Equipment |
| RI | 52.99 | $6,016 | Miscellaneous |
| SC | 43.28 | $43,295 | Transportation Equipment |
| SD | 60.85 | $5,689 | Miscellaneous |
| SK | 69.28 | $5,011 | Petroleum & Coal |
| TN | 44.07 | $62,945 | Transportation Equipment |
| TX | 69.85 | $283,992 | Petroleum & Coal |
| UT | 48.25 | $23,193 | Miscellaneous |
| VA | 54.6 | $50,656 | Beverage & Tobacco |
| VT | 51.82 | $3,644 | Computers & Electronics |
| WA | 74.66 | $79,621 | Transportation Equipment |
| WI | 42.65 | $71,499 | Food |
| WV | 71.26 | $9,280 | Chemical |
| WY | 83.86 | $2,818 | Petroleum & Coal |
| YT | 65.93 | $18 | Plastics & Rubber |