There are several reasons why manufacturing is so important to Ontario’s economy.
First, manufacturing is an important source of innovation. Second, manufacturing creates multiplier or ‘spin-off’ benefits that support a range of other private and public sector activities. This was the subject of a July, 2022 data bulletin. Third, total compensation in manufacturing is higher than the average in Ontario. This is significant in its own right, and is especially so given Ontario’s rising affluence and the presence of other well-paying industries throughout the province.
A primary focus of industrial policy has long emphasized encouraging job creation (i.e. quantity). When labour markets are tight, however, it becomes increasingly important to focus not simply on the number of jobs created by any investment, but on the quality of those jobs. This data bulletin examines total compensation, which is one of the most important measures of job quality. Put simply, higher wages equate to more consumer spending and more contributions to government revenues in the form of income and consumption taxes. Better fringe benefits, which are included in our measure of total compensation, equate to higher levels of health and well-being for employees and their families. They also tend to reduce the burden of government-funded social services and offer greater income security as employees age.
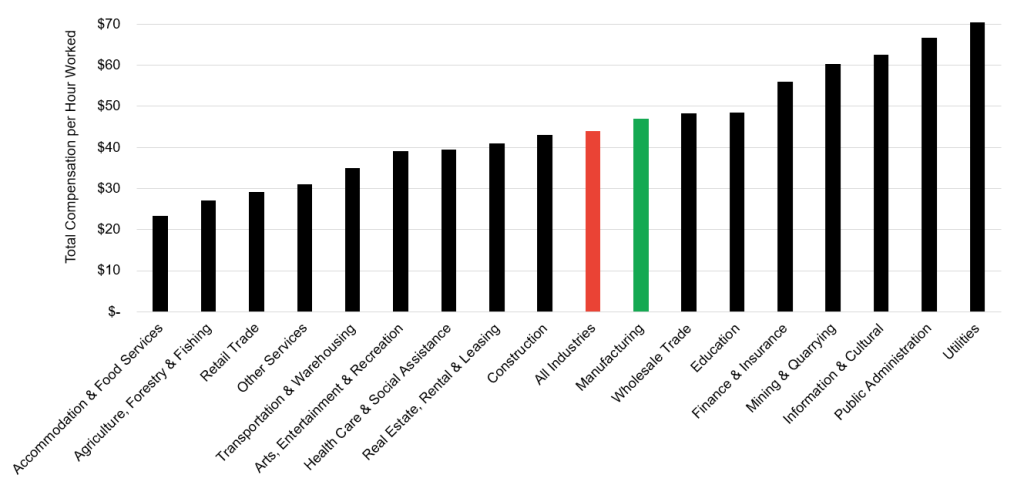
Manufacturing continues to offer total compensation that is higher than the average for all Ontarians (Figure 1). The wage premium associated with manufacturing, however, (relative to the average) has diminished over the past 25 years. This is because wages in other sectors have increased faster than manufacturing wages and because of employment growth in several lower-paying segments of manufacturing over the same time (e.g. commercial bakeries).
Figure 1 – Total Compensation per Hour Worked, Select Industries (2021)
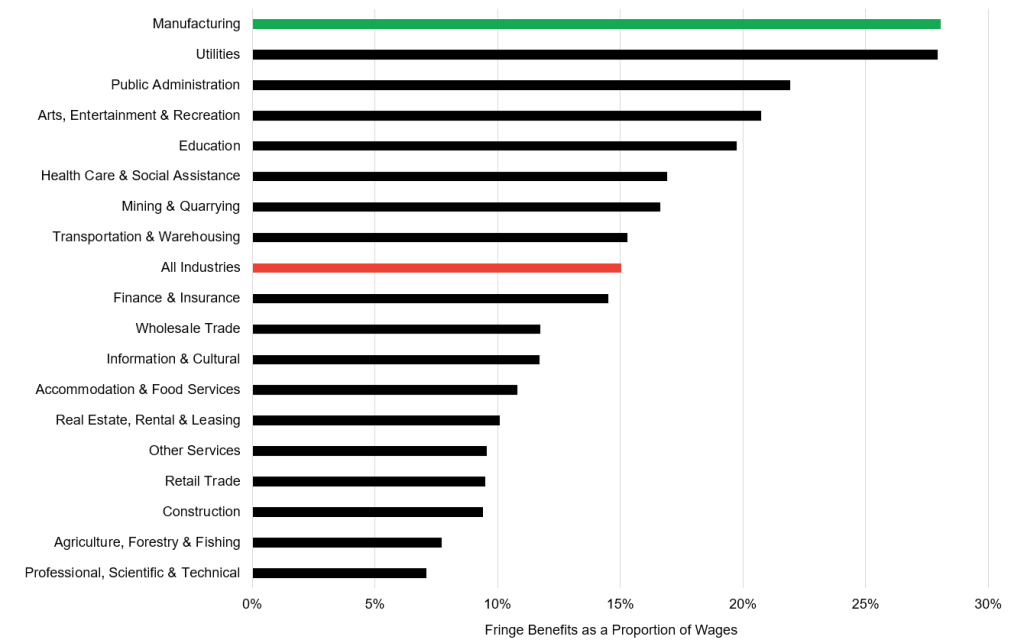
The benefit premium associated with manufacturing (as measured by the value of fringe benefits relative to wages), on the other hand, is the highest of any sector in Ontario (Figure 2). Included here are health and dental benefits (including insurance premiums), pension and retirement benefits, and educational allowances. Many of these fringe benefits are offered to employees and their immediate families. Put plainly, Ontario manufacturers offer greater fringe benefits than do employers in other sectors. That position has been further solidified over time as manufacturers continue to offer leading benefit packages while employers in other sectors have reduced their benefit offerings.
Figure 2 – Benefit Premium by Industry, Select Industries (2021)
Our analysis also reminds us that manufacturing is not monolithic. In many respects, manufacturing is more diverse than other sectors as defined by their two-digit NAICS codes. An estate winery, a vaccine producer, and an electric vehicle assembly plant are all examples of manufacturing. And some manufacturing industries offer much greater compensation than others. This is illustrated in Figures 3 and 4.
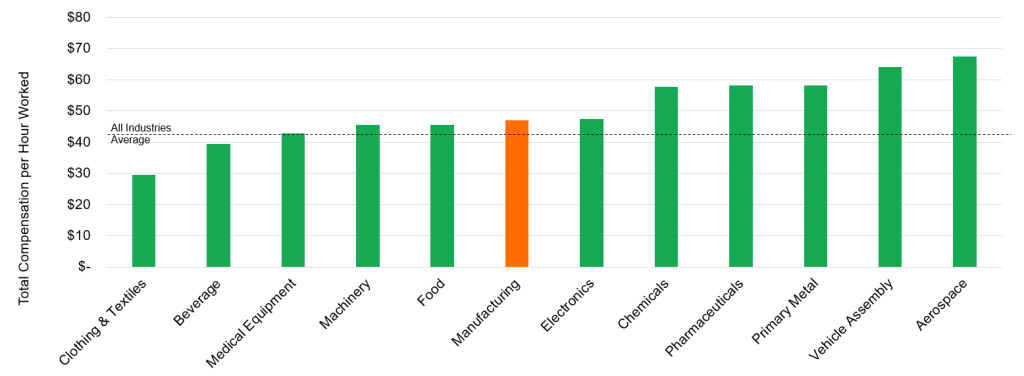
Figures 3 and 4 show that certain industries, including motor vehicle assembly, aerospace, primary metal (in Ontario steel mills and nickel refineries), and pharmaceutical product manufacturing offer total compensation that is substantially higher than the average for almost every sector. In the case of vehicle assembly and aerospace, average compensation ranks among the highest sectors of the province’s economy, and is nearly three times the average total compensation in the accommodations, food service, or retail sectors. Other manufacturing industries, however, such as clothing, textiles, and food manufacturing, do not compensate employees nearly as well. But even within these industries there exist higher-paying sub-industries (e.g. dairy product manufacturing). Again, the manufacturing sector itself is so diverse that more detailed analysis is warranted and forthcoming in future Trillium Network bulletins and reports. Stay tuned.
Figure 3 – Fringe Benefits and Wages per Hour Worked, Select Industries (2021)
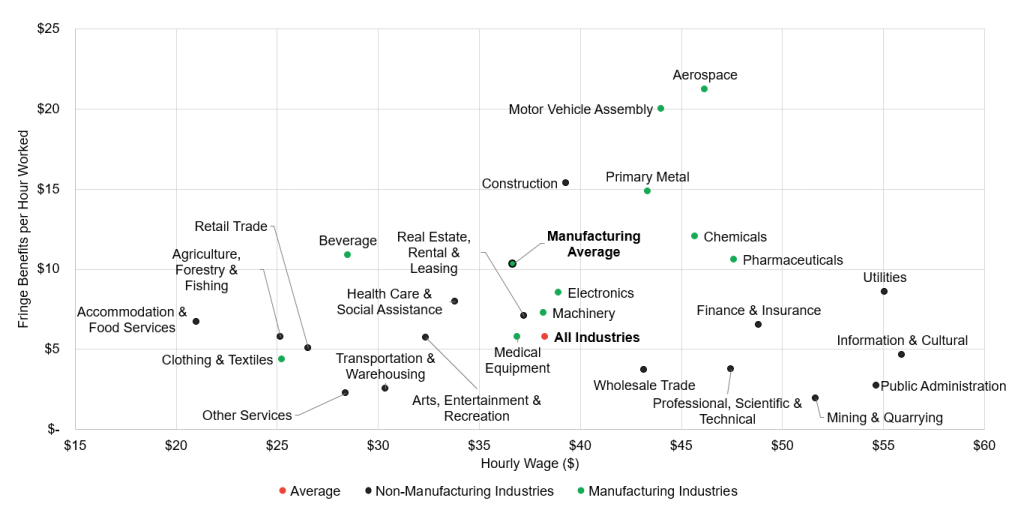
Figure 4 – Total Compensation per Hour Worked, Select Manufacturing Sub-Industries (2021)
Key Takeaways:
- Manufacturers are by no means immune to tight labour markets. Some manufacturers may find value in re-considering the structure of their compensation packages as a means to attract new employees, especially if those new employees value wages over fringe benefits. This is likely the case for younger generations.
- Alternatively, manufacturers that offer competitive fringe benefit packages may want to do more to promote their advantages and value of those benefits over the longer-term.
- There is considerable value in government policies and programs that support manufacturing industries that compensate employees well, such as aerospace and vehicle assembly.
- Policies and programs designed to turn lower-paying manufacturers into higher-paying manufacturers make sense and are especially useful if they emphasize investments in automation and advanced production technologies (i.e. Industry 4.0).